3D geospatial visualization
Innovation and hurdles in revealing our environment
3D visualization is at the heart of many geospatial data applications. Progress in 3D visualization has drastically reduced barriers to entry for new products based on large datasets, thanks to improved hardware and software. Challenges persist, but the adoption of tiled 3D models and standards such as 3D Tiles promises easier data consumption and sharing, driving down costs and enabling deeper integration for impactful geospatial applications. This article summarizes progress in visualizing large 3D datasets for geospatial and reality capture applications, and ongoing issues and considerations required for this powerful technology.
The geospatial revolution has seen major advances in acquisition hardware, processing software and cloud technology over the last decade. New users are finding geospatial technology increasingly accessible. As data availability (either new acquisitions or open public archives) has increased, so too has the need to communicate results. No longer is 2D (or 2.5D) the only option. 3D visualization has become the icing on the cake, creating both novel ways to inspect and analyse complex datasets and attractive outputs for presentation of results to stakeholders, collaboration, promotion and publication.
Flood mapping and simulation, BIM, city modelling, digital twins and natural resources are examples of major domains requiring visualization, although, as elsewhere in the geospatial world, the number of applications is truly diverse. As such, current visualization is driven by user needs and the industry’s growing awareness of its potential.
State of the art
3D graphics technology has been gaining interest since the 1980s. With developments such as OpenGL, Direct3D and scene graphs in the 1990s, and the introduction of programmable shading pipelines in the 2000s, engineers were able to leverage increasingly powerful graphics processing units (GPUs) on desktop PCs to visualize large and complex 3D models. More recently, browser-based graphics (through WebGL), game engines (such as Unity and Unreal) and a new generation of graphics application programming interfaces (APIs) such as Vulkan, Metal and WebGPU offer the industry new opportunities and a roadmap for placing visualization at the centre of products and services.
Despite these advances, 3D geospatial visualization has historically been characterized by ad hoc or custom solutions, developed at high cost for specific application needs. While many vendors now provide software for generating 3D models from photogrammetry or Lidar, the next step for value addition in applications is still a challenge.
Data and standards
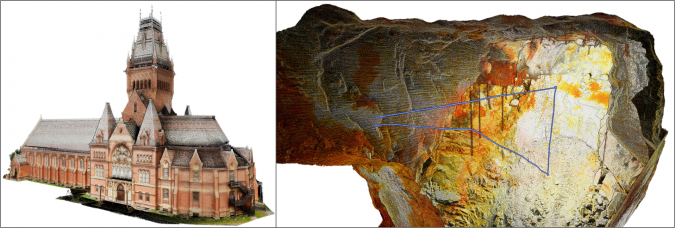
Spatial data in many 3D visualization applications is often either point clouds (XYZ point coordinates, optionally with properties such as colour or reflectance; Figure 1) or meshes (XYZ vertices, triangle connectivity and optional surface normal, colour or material information). In reality capture, meshes are often augmented with photorealistic texture, obtained from increasingly high-resolution digital imagery. In addition to vertex and triangle data, these have texture coordinates per vertex and associated packed texture images.
Interoperability of 3D data between visualization solutions is crucial. For point clouds, dedicated formats have been developed by the geospatial industry: LAS and E57. For meshes, it has been customary to adopt common 3D graphics data standards, such as the OBJ, FBX or, more recently, glTF formats. The main advantage of such formats is that they can easily be parsed by most 3D graphics software, with open-source code libraries available for developers to integrate into their own solutions. However, an important drawback is that they are monolithic: a complete dataset is stored as a single geometry file (with accompanying material or texture image files in the case of textured meshes). Furthermore, these formats were not designed for use with geospatial coordinate systems, requiring additional treatment in the rendering pipeline.
The large data question
An ongoing challenge for geospatial visualization is dataset size. Outputs from laser scanning or photogrammetry, either point clouds, meshes or textured 3D models, often comprise many millions – even billions – of points or triangles, and increasingly high-resolution texture images. Traditionally, real-time 3D visualization was limited by the computing hardware available, with high-specification workstations being a prerequisite, and heavy data (and therefore accuracy) reduction being necessary to ensure interactivity.
Several techniques have been developed to aid real-time visualization of large 3D datasets. Level of detail (LOD) approaches allow detailed 3D models to be intelligently simplified, resulting in lower resolution versions that can be rendered faster without losing visual fidelity. Likewise, mipmapping helps reduce the load on the rendering pipeline by optimizing the resolution of texture images depending on the distance between the model and virtual camera position in the 3D scene. A further method, normal mapping, encodes the detailed geometry of a 3D model into an image-like data structure, which is then rendered simultaneously with a coarse version of the model to give a realistic visual appearance. Taken individually, such techniques involve a trade-off between resolution and accuracy to ensure interactive rendering. However, when they are combined with one further, important data structure – tiled 3D models – and out-of-core memory management, a visualization pipeline for almost unlimited data sizes can be realized.
Tiled 3D models: advantages and standards
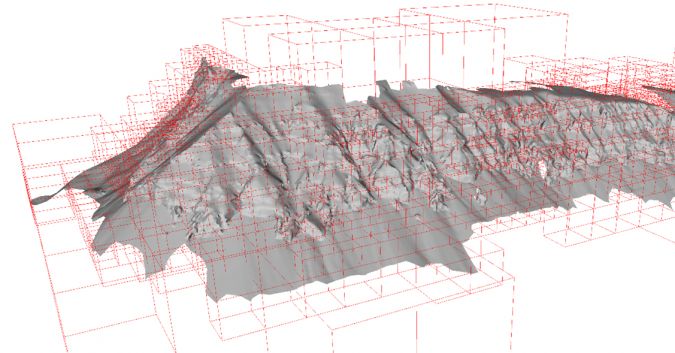
Acceleration data structures, such as octrees or kd-trees, allow 3D datasets to be hierarchically segregated based on their internal geometric density. For an original, high-resolution 3D model, a set of LODs is determined, with each level partitioned into spatial nodes, or tiles (Figure 2). The node tree is filled with the corresponding geometry for each level, before being saved to disk. The resulting hierarchy of disk files – a tiled 3D model – is linked by file references, and can be easily traversed by a 3D viewer equipped with a suitable memory management scheme. This ensures that the amount of data loaded at any instant is balanced based on the user’s current viewing position, meaning that large areas and highly detailed models can be performantly handled even on standard computers.
Until recently, there were few available standards for 3D tiled models, especially for web visualization, with the OpenSceneGraph (OSGB) format being one of the few in common use. The landscape has now changed, with revised Open Geospatial Consortium (OGC) Community Standards for 3D Tiles and Indexed 3D Scene Layer (i3S/SLPK) formats now gaining traction across the industry. These formats are designed for geospatial coordinate systems and suitable for streaming both point clouds and 3D models over the internet.
Cloud-aware 3D model access
A tiled 3D model may comprise many hundreds or thousands of small disk files, which can be challenging to share using conventional file copying. Cloud storage and repositories are instead a convenient way to distribute high-resolution 3D data, analogous to raster WMS or WCS standards. Making tiled 3D models accessible through APIs hides the dataset size and complexity for users, who can consume 3D data over the internet using cloud-aware software. Geometric and image texture compression, such as Draco and KTX, reduce storage needs and the amount of data that needs to be transferred. The power of 3D model streaming is now being realized through industry solutions (such as the ArcGIS or Cesium platforms) or tailored data repositories, such as V3Geo in the earth science domain.
Although highly convenient, data safety and security are essential considerations for organizations working with cloud 3D models. Local deployment can be important to ensure cloud agnostic storage, especially for government agencies that are constrained by national or organization boundaries. Popular cloud solutions from providers such as Amazon or Microsoft may not be appropriate for these organizations. IT system integration and security are challenges related to large data and visualization that must be handled sensitively.
Data integration
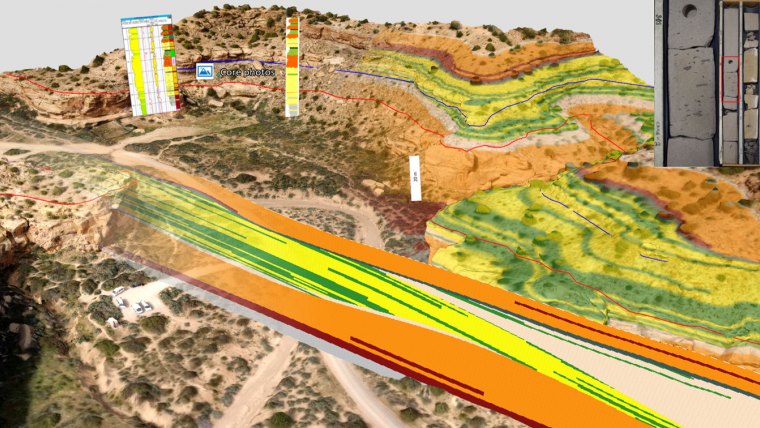
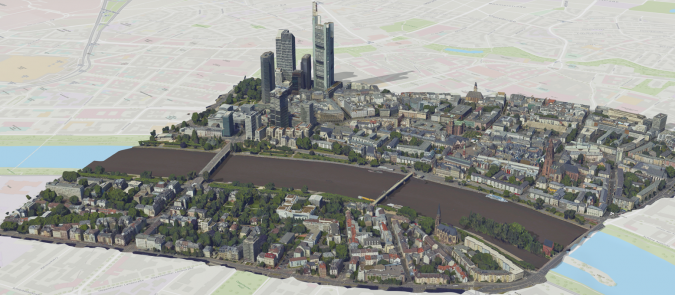
Large 3D point clouds and textured meshes are often the spatial framework for a wealth of supplementary data that can be used to communicate application-specific information. This may be additional georeferenced data, such as thematic maps, elevation models or vector files, as well as measurements, results from other analysis methods, time series and real-time sensor data, simulation results and more (Figure 4). This approach forms the basis for digital twins for managing data assets, as well as being essential in education and for stakeholder communication. A further important area of growth is the fusion of datasets from multiple sensors, especially from drones. Thermal, multi/hyperspectral or geophysical sensors mounted on drones add additional mapping capabilities, where visualization of combined 2D–3D outputs aids interpretation and validation of results.
Visualization hardware
Visualization is no longer restricted to high-end hardware requiring high expertise, resources and even physical space for Powerwall or CAVE facilities. Current computing hardware encompasses desktop, mobile and web, as well as devices offering immersive experiences, such as VR, AR and mixed reality. 3D visualization can therefore be deployed in a plethora of situations, from traditional work on a desktop PC to monitoring real-time acquisition or performing measurements and analysis of 3D data while in the field, as well as collaborative teamwork using immersive devices.
3D stereo viewing was once restricted largely to digital photogrammetric workstations or showcasing datasets in short presentations. For ‘real work’, stereo was often low resolution, dark and uncomfortable for long periods. Today’s passive stereo monitors are bright, sharp and have resolution up to current 4k standards. Increasingly, software is optimized for stereo users, with mouse cursors and even user interfaces that can be deployed seamlessly between conventional mouse/2D monitor and stereo/tracking device setups.
Final thoughts
Progress in 3D visualization has been dramatic, with the entry threshold for starting new products based on large 3D datasets now greatly reduced. Improved hardware, gaming engines and web graphics APIs facilitate high-performance rendering without the need for advanced workstations. The growing adoption of tiled 3D models and data standards such as 3D Tiles, together with cloud storage, offer a step change in how large 3D datasets can be consumed, shared and published. For the geospatial industry, this lowers the cost for development teams and users, who can now focus resources more on integrating disparate datasets and achieving application results.
Challenges remain, with rapidly changing visualization technology requiring frequent updates and expertise development. Although graphics hardware, APIs and data formats have moved towards standardization, the overall picture in 3D visualization is still one of fragmentation, often with different approaches required for desktop, mobile and web development and for different operating systems. No single technology will fit all situations. However, progress continues, with cross-platform and desktop-web solutions such as WebGPU in development, and gaming engines increasingly accessible across multiple devices. The future of 3D geospatial visualization for creating engaging and attractive experiences is assured.

Value staying current with geomatics?
Stay on the map with our expertly curated newsletters.
We provide educational insights, industry updates, and inspiring stories to help you learn, grow, and reach your full potential in your field. Don't miss out - subscribe today and ensure you're always informed, educated, and inspired.
Choose your newsletter(s)


