Transforming cadastral surveying for Ghana’s future
Innovative methodologies and mobile technology integration
Incorporating smart methodologies in cadastral surveying is improving the land acquisition system in Ghana. Traditional cadastral surveying is time-consuming and, if not planned out well, could cost a fortune to survey larger land areas. In a recent project, a cadastral map was produced for a large area in just 20% of the proposed duration thanks to the use of mobile applications by local townsfolk in the cadastral surveying process.
The aim was to prepare a cadastral plan for 21,000 acres (approx. 8,500 hectares) of land situated at Jomoro in the Western Region of Ghana. The land to be surveyed is generally mountainous with lush green vegetation, farms, towns, villages and roads, and is bounded on the south by the Atlantic Ocean. The main occupations of inhabitants are coconut farming and fishing.
The traditional way of preparing a cadastral plan would have involved sending a survey party ahead of the actual survey to locate and clear the entire boundary in order to mount pillars. This would have been an arduous task, possibly involving the use of handheld GPS to locate the boundary points and the deployment of labourers to clear the line of sight where necessary. In an area with dense vegetation, it could take a whole day or more to survey 1km of boundary. The survey party would be made up of surveyors, local guides and labourers only; any other accompanying persons would be of little to no help in locating boundary pillars. The other time-consuming challenge would have been to identify the best and fastest accessible route to arrive at a boundary point. When it comes to routing, even experienced local guides are no match for today’s tools such as Google Earth.
Data collection methodologies would usually involve creating an on-site office with computers to capture all the attribute data in a database, scanners to scan paper documents, cameras and cameramen to take photographs of farm owners, printers and verification machines. For 21,000 acres of land, a minimum of 20 workers – including data collectors with expert knowledge in computing, especially Microsoft Office – would need to be employed for at least ten months to collect and process all the data. A separate survey team would have to be employed, equipped with handheld GPS, to accompany farm owners to all the boundaries to measure, process, plot and reconcile with the attribute data collected. With this running concurrently with the main boundary survey, data processing, plotting and approval, the estimated duration of such a project could be a minimum of 20 months.
The need for faster ways of surveying
To support policy decisions, however, there was an urgent need to complete this entire project within four months, so faster ways of surveying were required. Mobile technology, GIS and the use of uncrewed aerial vehicle (UAV or ‘drone’) technologies had already been successfully implemented on other projects with outstanding results and were therefore considered for use in this project.
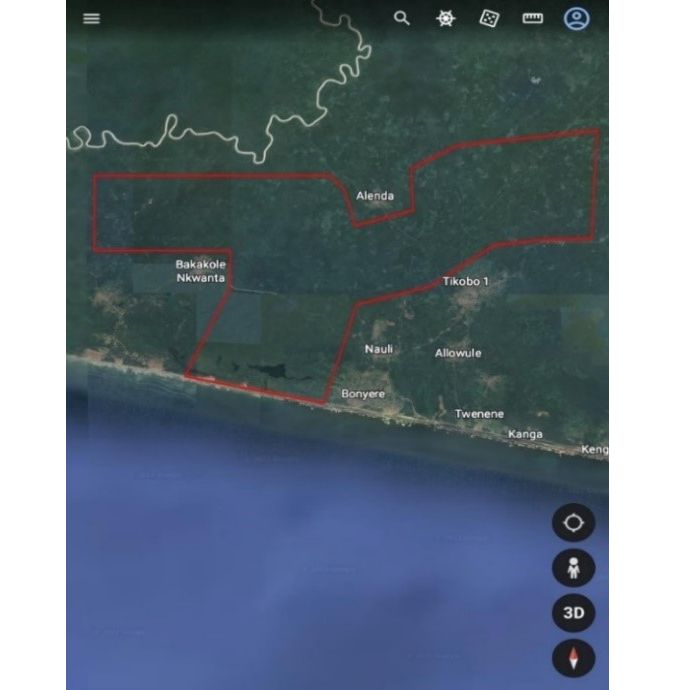
In terms of the reconnaissance survey and preparation for data collection, the only available data was a paper map indicating the proposed boundary of the land. The position of the boundary on the ground was unknown. However, the towns where the proposed boundary was passing through were located, visited and informed ahead of the survey. The paper map of the area to be surveyed with coordinates in the Ghana National Grid coordinate system was scanned into QGIS, georeferenced and the boundary digitized. A total of 26 pillar points and 100 auxiliary points were picked along the boundary to be set out on the ground. The boundary shapefile was then converted to a Keyhole Mark-up Language (KML) file in the WGS84 system and imported into the Google Earth mobile application.
More than half of the population of Ghanaians own smartphones with good network coverage. To enable the use of smart technology as a tool in promoting sustainable development, local townsfolks with Android smartphones were selected and trained in Google Earth, Mobile Topographer and Open Data Kit (ODK). The selected data collectors were chosen based on their efficient data collection and interpretation skills after two days of training and assessment. Free mobile applications of Google Earth, Google Maps, Mobile Topographer and ODK were downloaded and installed on the data collectors’ smartphones.
Navigation and boundary location using Google Earth
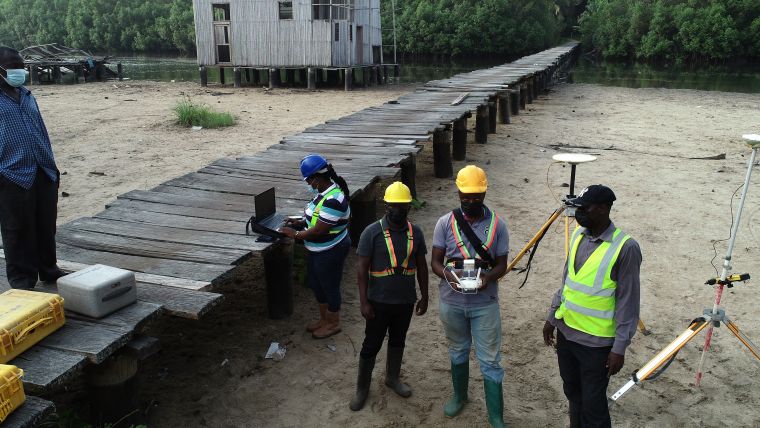
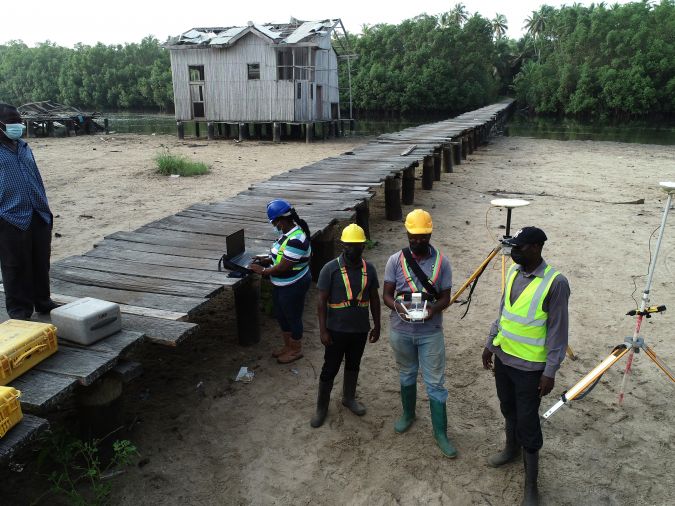
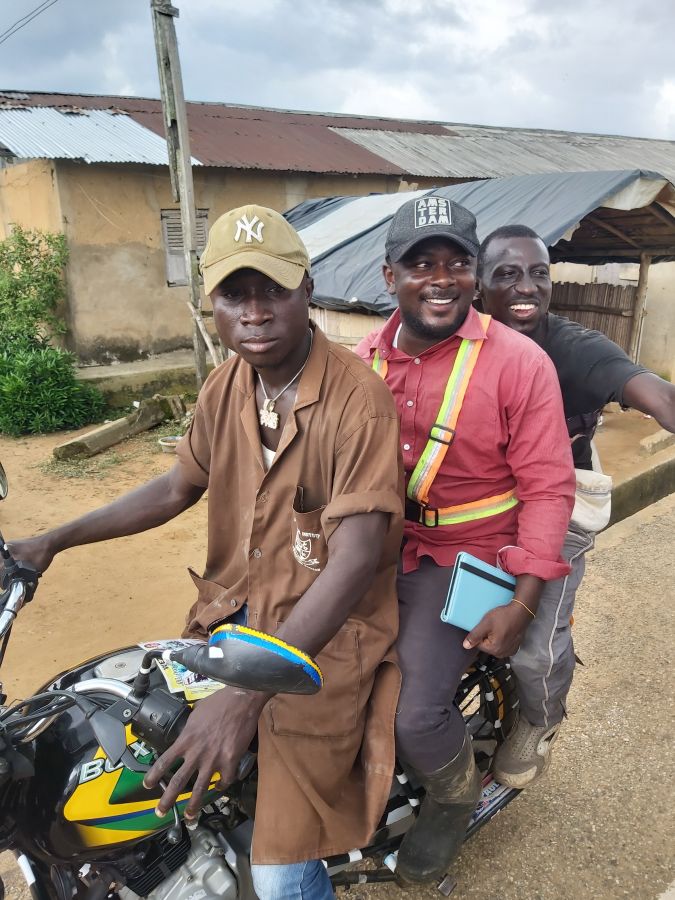
A typical day’s work included planning the points to be established by each survey party, driving on motorable roads in a pickup truck to get as close as possible to those points, then changing to either a three-wheeler or motorcycle to use paths, trails or farm routes to get even closer to the boundary point.
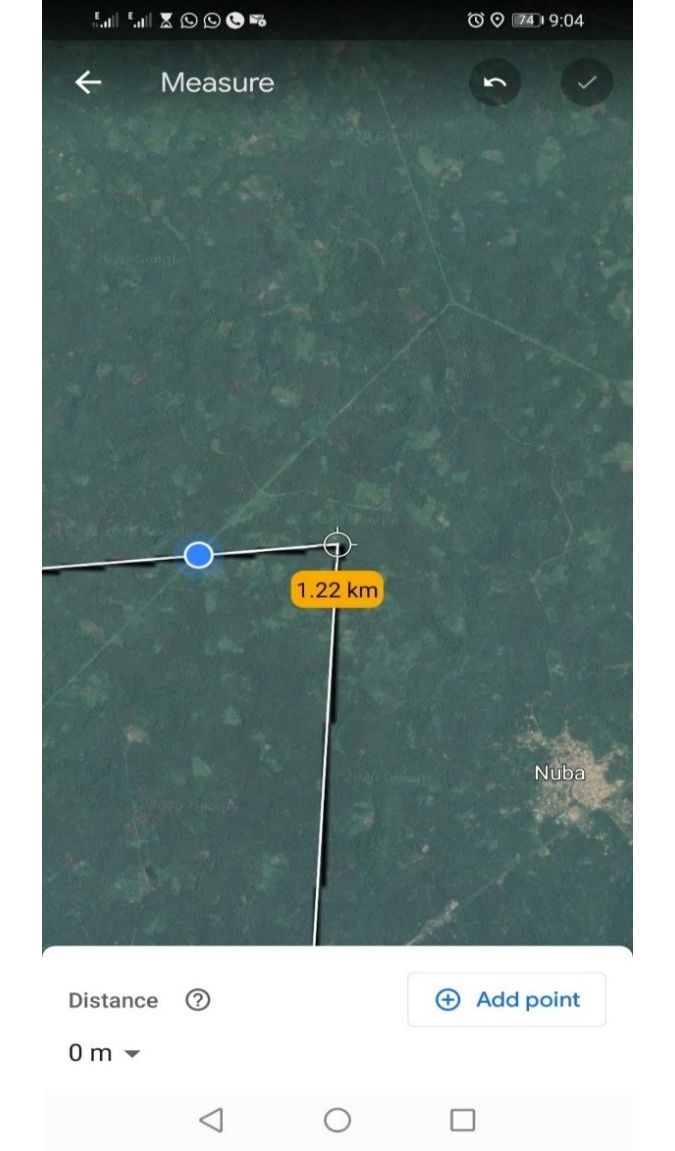
With GPS-supported smartphones which had the Google Earth mobile application installed on them, survey parties navigated to the boundary points (Figure 1). The location tracker of the smartphone was enabled in order to know the surveyor’s position at any point in time. Google Earth and the loaded KML file were opened. As the surveyors moved towards a boundary point,
they could determine the shortest distance and the fastest way (Figure 2). The measure tool in Google Earth was used to measure the remaining distance between the surveyor and the location of the boundary point. This informed the surveyor of the remaining distance, best route and also the direction to the boundary point of interest. Prior to entering areas with poor mobile network connectivity, the surveyors loaded and start navigation on Google Earth in order to be able to locate boundary points offline.
Once at the boundary point, the surveyor placed a temporary pole on stable ground. This was subsequently used by the pillaring team to establish concrete pillars. If the boundary point was located at a farm, the owner was contacted before concrete pillars were mounted. In the case of a few areas with dense vegetation, labourers were hired in the local town to clear it and provide easy access.
A static GPS survey was conducted to survey all the concrete pillars, commencing from a national benchmark base with known national coordinates. On average, the accuracy of the located points was below 5m. This was largely due to the small-scale nature of the paper map, map generalization and digitization.
Auxiliary data collection using Mobile Topographer and ODK
To create a land information system (LIS) to aid valuation for compensation in the land acquisition process, it was necessary to identify ownership of farmlands. Most farm owners had documents dating back hundreds of years with landmarks as boundary identification, and many farm owners used the traditional way of land measurement by employing the 10m stick method. Despite these challenges, every farm owner was able to show their boundaries with other farms without misunderstandings. However, for the purposes of the cadastral map, it was decided to use technology to confirm and digitize these boundaries.
Mobile Topographer application uses the GPS functionality in a smartphone to obtain geographical coordinates. This application turns the smartphone into a handheld GPS device that can be used for measurements with an accuracy of less than 1m. After receiving training in the use of Mobile Topographer and ODK, data collectors were put in groups with opinion leaders in each town to facilitate the coordination between the surveyor and the farm owners.
On a typical working day, an early-morning announcement in the town confirmed the location where the survey party would be working and reminded people about which types of documents to take along to the farms for the data collection exercise. Prior to the survey, farmers were advised to clear their boundaries for easy access. The survey party proceeded to the first farm and the farm owner – together with opinion leaders and the owners of neighbouring farms – walked along their boundaries. The data collector followed, picking eastings and northings at a minimum interval of 20m. The data collectors stored the data of each boundary separately with a unique parcel identity number, exported it in Excel CSV format and then sent it to the surveyor for data processing at the end of the day (Figure 3).
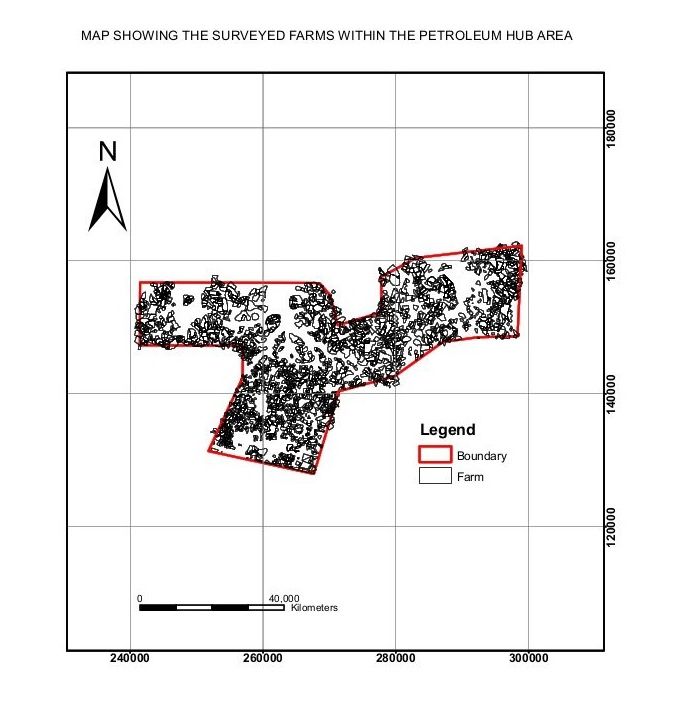
The ODK application is a simple tool for data collection. A questionnaire was developed to collect relevant information – in addition to the farm size – from farm owners to aid valuation and compensation (Figure 4). The proof of identity and other documents were captured using smartphone cameras and uploaded into ODK. Other details such as name, age, contact details and so on were also requested and recorded. At the close of the day, the collected data was uploaded onto a server which surveyors could access using a link. The final output was a cadastral map and digital map (Figure 5) showing attribute data of farmland parcels in a GIS environment.
Conclusion
Working with trained townsfolk reduced the labour and accommodation costs as well as bridging the language barrier. The project also supported technology transfer and created employment for the townsfolk, which improved their standard of living. Google Earth made it easier to find the shortest accessible routes to establish boundary points, with minimal clearing of farmland and vegetation. Since their own people were part of the measurement and survey process, townsfolk were cooperative and there were no disputes. The use of Mobile Topographer helped more farmers to engage with the trained data collectors privately, and most farm owners were delighted to finally know the actual size of their lands at no cost to themselves. The data collected with ODK created a comprehensive database which improved the valuation and compensation process. The project took a total of four months, rather than 20 months if the traditional method had been employed.
Further reading
Quaye-Ballard N. L., Asenso-Gyambibi D., Quaye-Ballard J. A., Yeboah E. and Asamoah A. Application of Smart Technologies in Cadastral Surveying of Large Areas in Ghana, FIG Congress 2022 ‘Volunteering for the future – Geospatial excellence for a better living’, Warsaw, Poland, 11-15 September 2022
Value staying current with geomatics?
Stay on the map with our expertly curated newsletters.
We provide educational insights, industry updates, and inspiring stories to help you learn, grow, and reach your full potential in your field. Don't miss out - subscribe today and ensure you're always informed, educated, and inspired.
Choose your newsletter(s)


